Alnahwi, A., Kosanke, T., Loucks, R. G., Greene, J., Liu, X., & Linton, P. (2020). High-resolution hyperspectral-based continuous mineralogical and total organic carbon analysis of the Eagle Ford Group and associated formations in south Texas. AAPG Bulletin, 104(7), 1439–1462. https://doi.org/10.1306/02262018156
Barker, R. D., Barker, S. L. L., Cracknell, M. J., Stock, E. D., & Holmes, G. (2021). Quantitative Mineral Mapping of Drill Core Surfaces II: Long-Wave Infrared Mineral Characterization Using μ XRF and Machine Learning. Economic Geology, 116(4), 821–836. https://doi.org/10.5382/econgeo.4804
Barker, R. D., Barker, S. L. L., Wilson, S., & Stock, E. D. (2021). Quantitative Mineral Mapping of Drill Core Surfaces I: A Method for µ XRF Mineral Calculation and Mapping of Hydrothermally Altered, Fine-Grained Sedimentary Rocks from a Carlin-Type Gold Deposit. Economic Geology, 116(4), 803–819. https://doi.org/10.5382/econgeo.4803
Bedell, R. L., Rivard, B., Browning, D., & Coolbaugh, M. (2017). Thermal Infrared Sensing for Exploration and Mining-An Update on Relevant Systems for Remote Acquisition to Drill Core Scanning. Proceedings of Exploraiton 07: Fifth Decenial International Conference on Mineral Exploration Editied by V.Tschirhart and M.D. Thomas, 17, 881–897.
Beltrán-Cabrera, Jorge. (2020). Caracterización geológica y modelo magmático-hidrotermal utilizando swir en barridos hiperespectrales en el yacimiento tipo pórfido de cobre Los Humos, Caborca, Sonora México. M.C: Universidad de Sonora. 188 p.
Bonner, W.M., 2019, Spatial and Temporal Relationships between Carlin-style Gold and Polymetallic Mineralization at the Deep Cove Gold-Silver Deposit, Lander County, NevadaMSc: Reno, University of Nevada: 156 p.
Coulter, D. W., Harris, P.D., Wickert, L.M., & Zhou, X. (2017). Advances in Spectral Geology and Remote Sensing. Exploration 17: Sixth Decennial International Conference on Mineral Exploration Edited by V. Tschirhart and M.D. Thomas, 17, 23–50.
Hamedianfar, A., Laakso, K., Middleton, M., Törmänen, T., Köykkä, J., & Torppa, J. (2023). Leveraging High-Resolution Long-Wave Infrared Hyperspectral Laboratory Imaging Data for Mineral Identification Using Machine Learning Methods. Remote Sensing, 15(19), 4806. https://doi.org/10.3390/rs15194806
Johnson, C. L., Browning, D. A., & Pendock, N. E. (2019). Hyperspectral Imaging Applications to Geometallurgy: Utilizing Blast Hole Mineralogy to Predict Au-Cu Recovery and Throughput at the Phoenix Mine, Nevada. Economic Geology, 114(8), 1481–1494. https://doi.org/10.5382/econgeo.4684
Kraal, K. O., Ayling, B. F., Blake, K., Hackett, L., Perdana, T. S. P., & Stacey, R. (2021). Linkages between hydrothermal alteration, natural fractures, and permeability: Integration of borehole data for reservoir characterization at the Fallon FORGE EGS site, Nevada, USA. Geothermics, 89, 101946. https://doi.org/10.1016/j.geothermics.2020.101946
Laakso, K., Väliheikki, H., Törmänen, T., Pesonen, J., Tiljander, M., & Nykänen, V. (2026). The mid- and long-wave infrared hyperspectral characteristics of the carbonate minerals of the Hirvilavanmaa orogenic gold deposit, Central Lapland Greenstone Belt, Finland. International Journal of Remote Sensing, 1–25. https://doi.org/10.1080/01431161.2026.2612901
Langa, W. M., Ndou, C., Zieger, L., Harris, P., & Wagner, N. (2024). Hyperspectral imaging of coal core: A focus on the visible-near-shortwave infrared (VN-SWIR) region. International Journal of Coal Geology, 284, 104456. https://doi.org/10.1016/j.coal.2024.104456
Linton, P., Kosanke, T., Greene, J., & Porter, B. (2024). The application of hyperspectral core imaging for oil and gas. Geological Society, London, Special Publications, 527(1), SP527-2022–2. https://doi.org/10.1144/SP527-2022-2
Linton, P., Montoya, P., Pendock, N., Jahoda, R., & Harris, P. (2013). The application of hyperspectral core imaging to exploration and geometallurgy: A case study from the La Colosa gold porphyry, Colombia Ore-forming fluids from deep magmatic source to shallow environments View project The application of hyperspectral core imaging to exploration and geometallurgy: A case study from the La Colosa gold porphyry, Colombia. https://www.researchgate.net/publication/294431080
Mashaba, D. (2021) An investigation into the complementary capabilities of x-ray computed tomography and hyperspectral imaging of drill core in geometallurgy. University of Cape Town Thesis, p.181.
Roache, T. J., Walshe, J. L., Huntington, J. F., Quigley, M. A., Yang, K., Bil, B. W., Blake, K. L., & Hyvärinen, T. (2011). Epidote–clinozoisite as a hyperspectral tool in exploration for Archean gold. Australian Journal of Earth Sciences, 58(7), 813–822. https://doi.org/10.1080/08120099.2011.608170
Rost, E. (2023). The influence of geologic sample surfaces on TIR spectroscopy [PhD, University of Twente]. https://doi.org/10.3990/1.9789036557191
Tappert, M. C., Rogge, D., & Knudson, C. (2024). Lithotype analysis of hyperspectral imagery collected from drill core for the purpose of rapidly identifying critical mineral deposits in Alberta.
Telemark, N., Coint, N., & Dahlgren, S. (2019). Rare earth elements (REE) in two long drill-cores from the Fen Carbonatite Complex Title: Rare earth elements (REE) in two long drill-cores from the Fen Carbonatite Complex, Telemark, Norway (preliminary version) Telemark Nome Map-sheet name (M=1:250.000).
Tibane, Lowanika & Harris, P. & Pöllmann, Herbert & Ndongani, Fillsmith & Landman, Brandon & Altermann, Wladyslaw. (2021). Data for evaluation of the onshore Cretaceous Zululand Basin in South Africa for geological CO2 storage. Data in Brief. 39. 107679. 10.1016/j.dib.2021.107679.
Toews, Zach, 2023, Capturing Fine-Scaled Reservoir Heterogeneities Using Hyperspectral Core Scanning in the Montney Equivalent Sulphur Mountain Formation. University of Calgary, Canada. MSc thesis.
False Colour Composite – False Colour Composite (FCC) Images are where the red, green and blue values correspond to infrared bands rather than the true colour bands. The FCC images are artificially generated colour images using bands beyond the visible light to enhance features in the infrared.
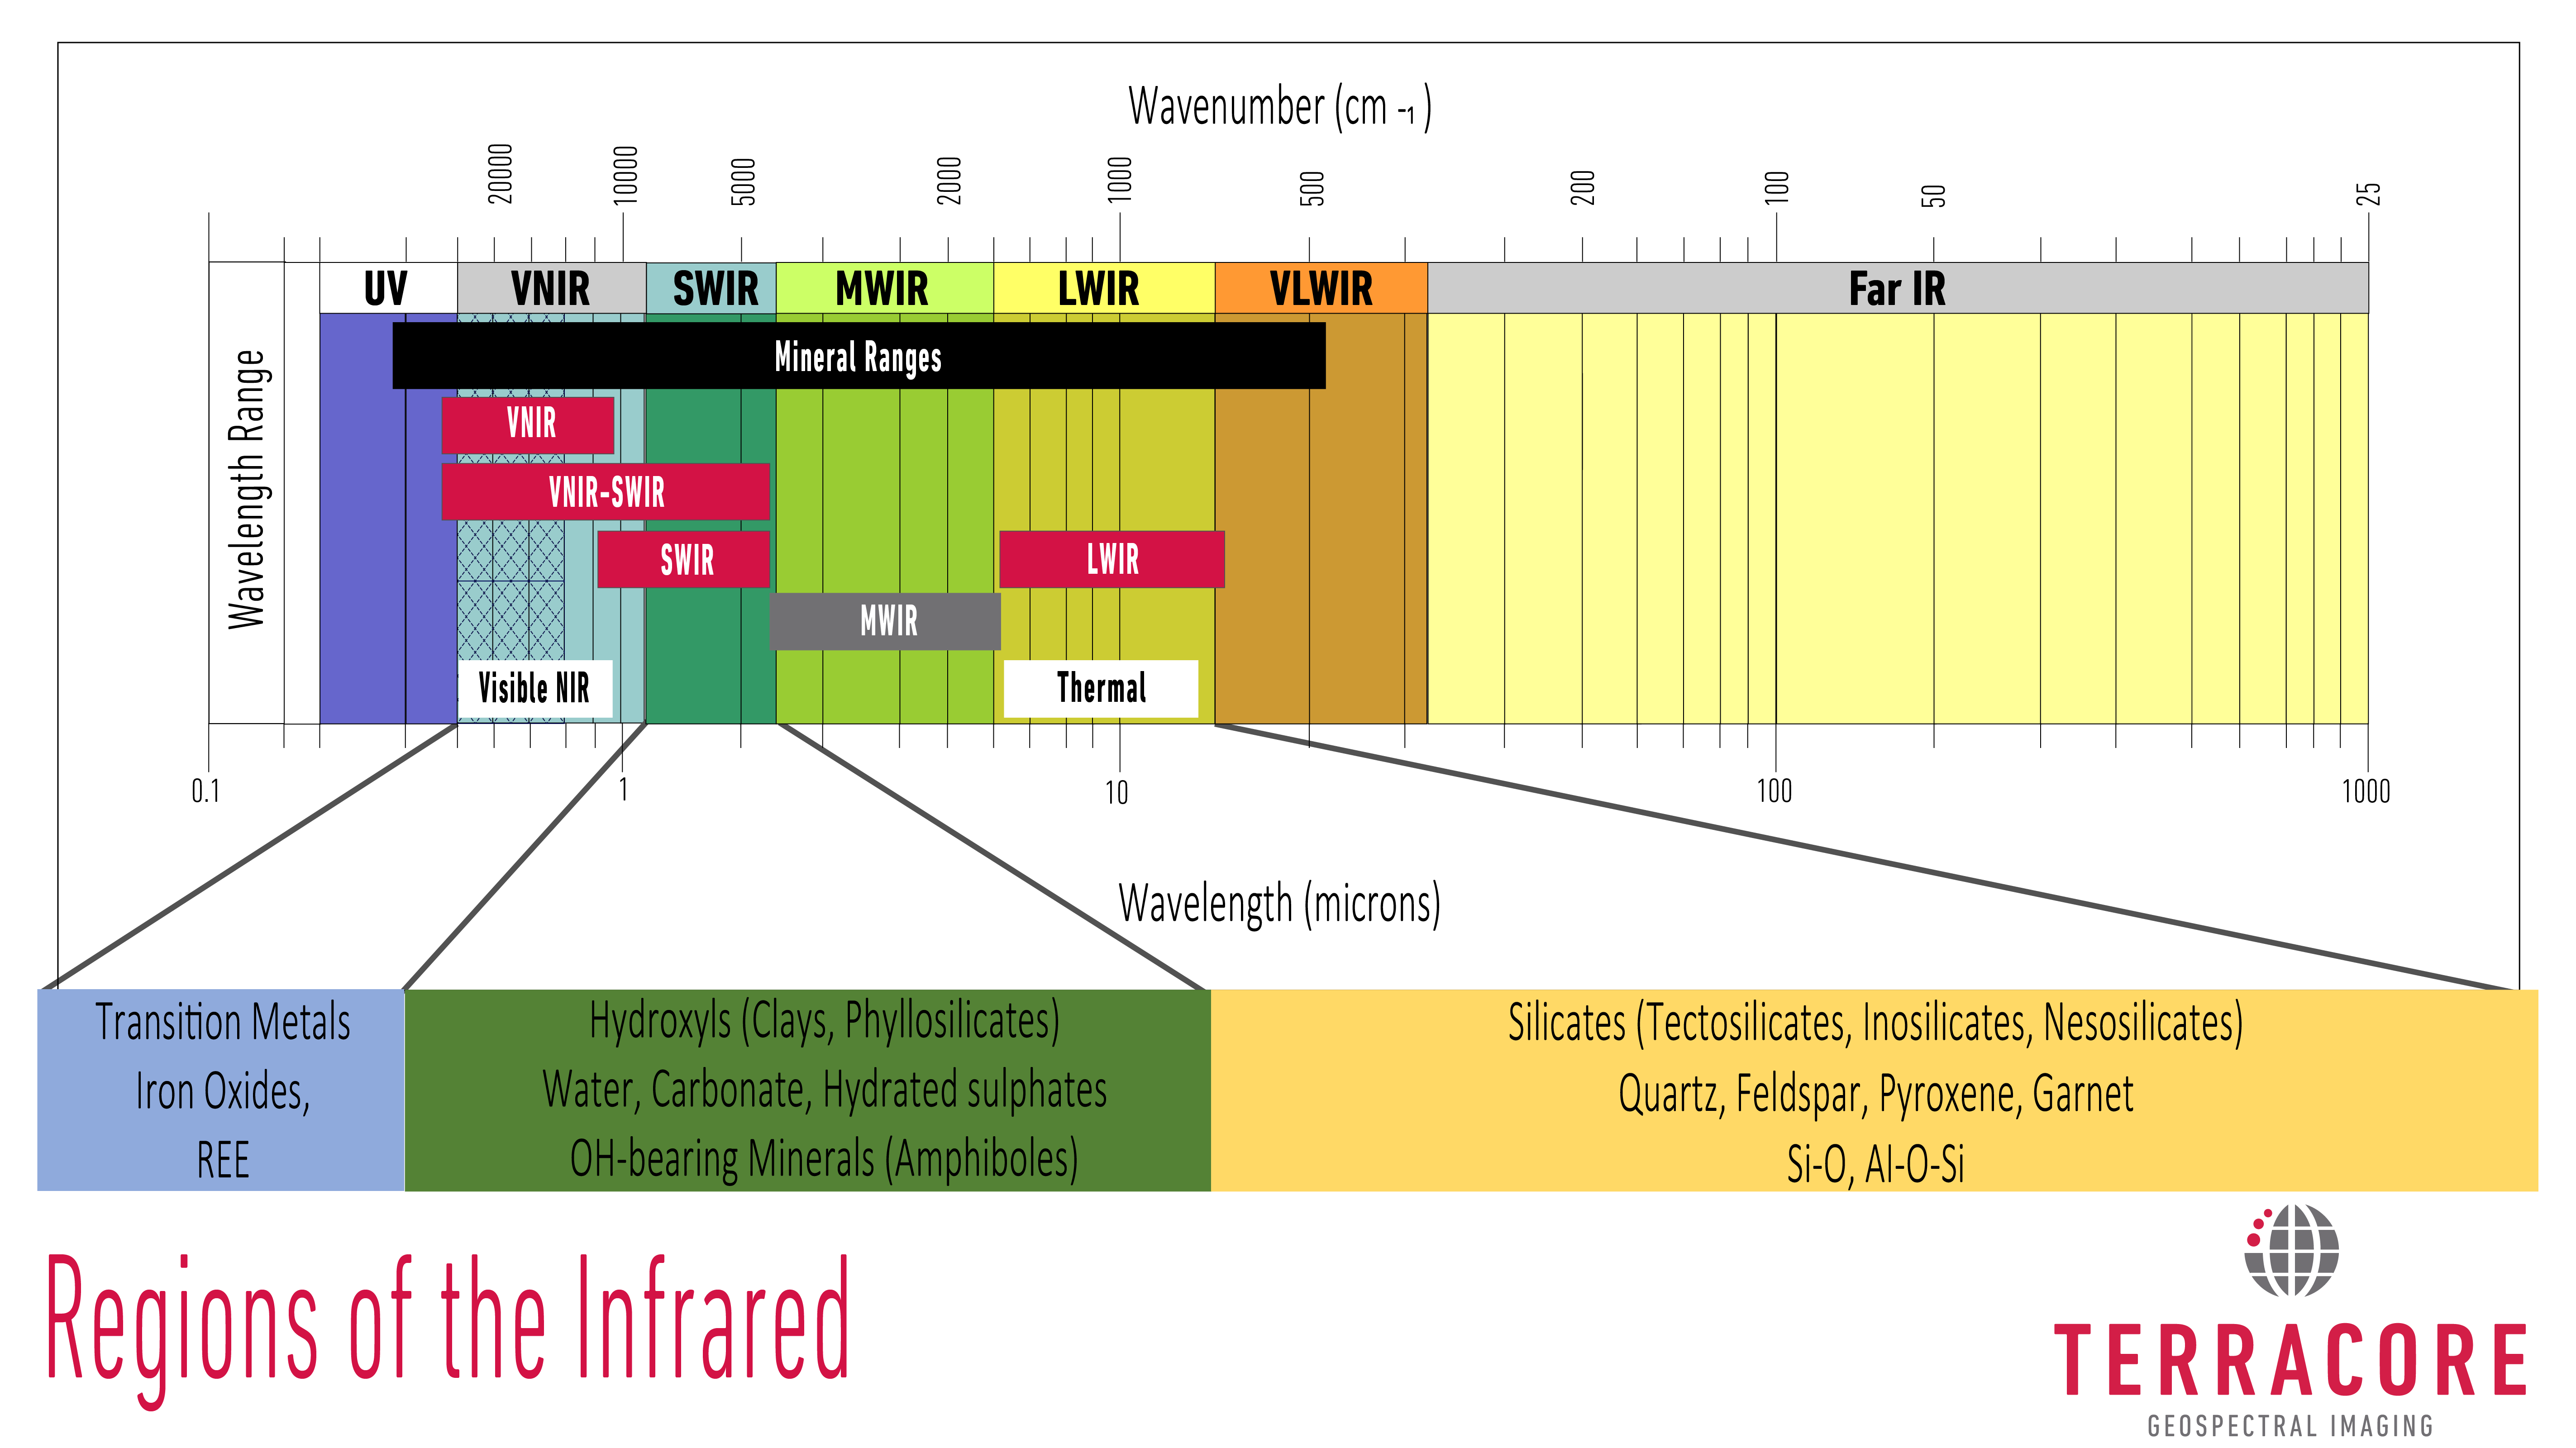
LWIR (Long Wave Infrared) – A portion of the electromagnetic spectrum that includes both visible light and near-infrared radiation. LWIR typically spans wavelengths from about 8000 nm(nanometers) to 15 000 nm.
Mineral Indices – Mineral Indices map the spatial distribution of specific mineral related features across an image. These range from the intensity of the spectral signature related to a mineral, through compositional and crystallinity changes of a specific mineral. The slope of regions of the spectrum, as well as other textural changes can provide further information on the changing nature of minerals detected in the infrared.
Mineral Map – Mineral maps record the minerals or mineral combinations across an image. These are classification images where each pixel is mapped to a mineral schema and therefore map mineral presence and not mineral abundance.
MWIR (Mid Wave Infrared) – a portion of the electromagnetic spectrum that includes both visible light and near-infrared radiation. MWIR typically spans wavelengths from about 3000 nm(nanometers) to 8000 nm.
Push-broom vs Profiling Systems – Push broom systems create 2D images of the target material while a profiling system generated a single dimension track across the target. A push broom system creates an image of the target through movement of either the sensor over the target or the sample under the sensor. The detector element provides the one dimension while the other dimension is created through movement of the sensor or the target to create the image. In profiling the track is created in a similar way to a push broom system with the result being a profile across the sample. Ultimately, a push-broom system generates a resultant image while a profiling system generates a track across the sample.
RGB – (Red, Green, Blue) – The primary colors of light used in various digital displays and imaging technologies. Colors are created by combining different intensities of these three colors.
Spatial Resolution – The spatial resolution refers to the ability to distinguish between two separate objects or features in an image. It refers to the scale or size of the smallest unit of an image required to resolve an object. In hyperspectral imaging the unit of measurement is a pixel size calculated from an image using the number of elements in the detector array and the field of view of the sensor. Pixel size is typically measured in meters, millimetres or microns.
Spectral Parameters – Spectral parameters are significant changes that can be monitored across the electromagnetic spectrum under investigation. Typically, these include feature extractions where the characteristics of an absorption feature are described. These include absorption depth and wavelength position, asymmetry of the absorption feature, and the area under the absorption feature. These are typically extracted with a normalization process such as a continuum removal across the spectral range. Other spectral parameters commonly used include ratios of bands or feature extractions, maximum and minimum reflectance intensities, slope changes between several bands, and other measures for monitoring shape changes in spectral signatures.
Spectral Resolution – Spectral resolution describes the spectral characteristics of a sensor and its ability to distinguish between different wavelengths of the electromagnetic spectrum. Spectral resolution is related to the number of spectral bands and their widths, where the narrower the bands are the higher the spectral resolution. The position, number and width of the spectral bands determines how well individual targets can be discriminated. Spectral resolution is associated with single strength and the spatial resolution. Signal to noise ratios decrease with decreasing band widths and smaller target sizes so these parameters need to be optimised to achieve the best mix of spectral and spatial resolution and signal to noise for the sensor.
UV (Ultraviolet) – Type of electromagnetic radiation with wavelengths shorter than visible light but longer than x-rays.
VNIR (Visible Near Infrared) – A portion of the electromagnetic spectrum that includes both visible light and near-infrared radiation. VNIR typically spans wavelengths from about 400 nm(nanometers) to 1000 nm.